PaperCut provides many inbuilt report types, along with a variety of configuration options which allow you to tailor these to your needs. Furthermore, if output in an editable format such as CSV, the content of these reports can be rearranged, reformatted, and even reprocessed in order to create entirely new report types, either by hand, or through the use of scripts or macros.
But what if you need something highly specialised? You might be looking to create a professional looking, nicely formatted report akin to one of PaperCut’s inbuilt PDF reports, but differing in contents and appearance. You may even be hoping to programmatically collate your data in a way that none of our standard reports touch upon, and creating an automated workflow that transforms output from a PaperCut report into what you are after may be both difficult and cumbersome. If this sounds familiar, then a third party reporting tool might be the answer you are searching for!
This class of tool utilises a connection to your database to pull in data using queries. This data can then be inserted into report templates fashioned using the tool, similarly to creating documents using applications such as Microsoft Word. With this process, you can not only retrieve precisely the data you are after from the database, but also display it exactly as you would like. These custom reports can be generated independently from the PaperCut administration console and scheduling system, too, cutting out the middleman.
This article will walk you through the very basics of hooking up a PaperCut-administered external SQL database to one such tool, known as SAP Crystal Reports. This way, you can get your feet wet with the premise, begin to understand what is possible, and develop a basis for building out your own custom reports down the line. But enough talk already, lets see some reports!
Before We Get Started
… oh, okay, so there’s actually a few things we need to check off before we see those reports (can’t wait). Including:
Before going any further, take one last look through our existing reports to be absolutely sure that one of these can’t satisfy your requirements. Here’s a tip; head to the “Reports” tab in the PaperCut administration console, and choose one such as the “Print logs” report, found on the “Printer” subtab. If you select “Ad-hoc” from the dropdown menu next to this report, and then click on the small green Microsoft Excel icon found to the right, you will be taken to its customisation options. When run, the output of this report will be in CSV format, openable by a spreadsheet application of your choice (such as Excel or Google Sheets). The extra display space available to a CSV format report allows it to contain a lot more information than its PDF equivalent, and you may not need to do too much to get it into a workable format, depending on the intended audience.

Also a good idea to consider how frequently you will need to create this report! If it’s a once-off, or quite irregular, then you may save time by fashioning it manually, using the output of a CSV report in conjunction with a Microsoft Office (or equivalent) application. If you plan on running this report regularly, that’s a good sign that a third party tool may be the way to go.
You need to have hooked up your PaperCut deployment to an external database . In the following example, I’m using Microsoft SQL Server to host my PaperCut database. If you have a Microsoft SQL Server setup somewhere, then you should also have the Microsoft SQL Server Management Studio application I’ll be using, too.
Go ahead and install SAP Crystal Reports on a Windows machine in your environment. Now, this is a paid application, designed primarily for the reporting needs of small to mid-sized businesses, but if you are just keen on seeing what can be done, Crystal Reports can be freely trialled for 30 days . A good free alternative would be Jaspersoft iReport Designer , which is actually the software that was used to create PaperCut’s own reports.
Make sure you have access to the PaperCut Application Server, as well as credentials to access the PaperCut database instance.
All done? Me too, so it’s report time!
Step One: Add a Data Source
Some third party reporting tools include their own drivers which allow them to connect directly to a database, but in order for Crystal Reports to be able to see into our database, we will need to create a data source. A data source is effectively a connector, a conduit used by some applications to talk to your database, and to create one for this example, we will be using the “ODBC Data Sources (32-bit)” application bundled with Windows. Search for it using your Start menu, and note that we are using the 32-bit version instead of the 64-bit, because our Crystal Reports runtime is 32-bit. Other types of connections are possible (for example, PaperCut uses a “JDBC” connection), but this one suits our purposes just fine!
Once the application is open, jump over to the “System DSN” (System Data Source Name) tab and click to “Add…” a new system data source.

As I’m connecting to a SQL server database, I’m going to select the “SQL Server” driver for this data source.

I’m going to give the data source an appropriate name, “PaperCut”, and provide the hostname of my SQL server.

When prompted for authentication details for the database, I’m going to use SQL Server authentication as the type, and give it my database user credentials. In this example, I’m using the “papercut” user account I created for the PaperCut Application Server itself to use.

We can leave the rest of the options the same as we step through the remainder of the wizard. When presented the opportunity at the end, we should click to “Test Data Source…”. With any luck, we will be advised that the “TESTS COMPLETETED SUCCESSFULLY!” (whoever created this wizard may be even more excited for this report than I am). We can then “OK” our way all the way out of the “ODBC Data Source Administrator (32-bit)”, noting along the way that our “PaperCut” data source is now listed. Wave hello as you go past, if you like, but data sources don’t have feelings.


Step Two: Create a View
So we have made a connection for Crystal Reports to use, but what exactly in the database do we want to draw upon? To keep things simple, we are going to pull down a list of details for the users in our database, so we can recreate the PaperCut “User list” report. This is really only scratching the surface, of course, but I’ll clue you in to how to snaffle other data, too!
A view can be thought of as a query that can be sent off to your database, so it can send you back some of that sweet, sweet data. Crystal Reports will use our view (query) via our data source (connection) to get what we need it to have. Similar to the differing possibilities for data sources, there are many and varied methods of querying a database to this end, each with their own ups and downs. For my example, we are going to create a view using Microsoft SQL Server Management Studio.
When we open SQL Server Management Studio, we will be prompted for the hostname of our SQL server and our login credentials for it, the same as when we were creating our data source. Once connected, we will see a listing of the SQL server’s objects in the “Object Explorer” on the left-hand side of the screen. Exanding “Databases”, then my “papercut” database, and finally “Views”, we can see any views currently configured for the database. Right-clicking on the “Views” folder, we can then create a “New View…”.

There’s a possible branch in our path here, by the way, in the form of Stored Procedures. Procedures differ from views in that they can be programmatically passed various input values, changing what the procedure will return from the database when run. For example, we could have a Stored Procedure with a specifiable date range, so that we only get back data relevant to a chosen period of time. Going too deeply into how these work will take a little more time, though, so given my increasingly desperate, panicked need to see some reports, I’m going to say it’s outside of the scope of this article. Back to our new View!
Our View is going to contain an SQL query, a statement which selects certain tables within our database, and returns values stored within those tables. Written a few SQL queries in your time? Feel absolutely free to look over our database schema and cherry pick the tables and values important for your report. If you are not at all SQL savvy, though, not to worry. We have actually converted most of our existing reports into example base SQL queries already, and made them available in our GitHub. You could even extract the base SQL query PaperCut uses to run any of our reports yourself, straight from the Application Server’s logs, but that’s a topic for another day…
For this article, I’ll be using the base SQL statement our “User list” report employs. It has been copied from the PaperCut Application Server’s logs, and then cleaned up a little bit, just to make it easier on the eyes; you can find this prettified “user_list.sql” in the “User” subdirectory of the aforementioned GitHub repository . Once we have that to hand, we are going to copy it into the text entry field of our new View.

We then save and close the new View, giving it a descriptive name. I’ve chosen “vw_user_list_report”, but you could even call it “hnnnngrhk”, if nobody is looking over your shoulder. Right-click on the “Views” directory in the “Object Explorer” again, click to “Refresh”, and we should now see our View appear as available. And if we right-click on the name of the View in the “Object Explorer”, we can choose to “Select Top 1000 Rows”, running the query we have inserted into the View, and (hopefully) showing us a list of our database’s usernames and other attributes. Now can we PLEASE make a report already?


Step Three: Reports Time
YES. Let’s launch SAP Crystal Reports, and click on the “Blank report” link found just below the “START A NEW REPORT” heading. The “Database Expert” window should appear, and we will want to click to “Create New Connection” so we can get our data source patched in. From the connection types available, I’m going to choose “ODBC (RDO)”, in line with what I created back in Step One.

We should then see our “PaperCut” data source, which we will select before hitting “Next”. We are asked once again for our database credentials, along with the name of the database.

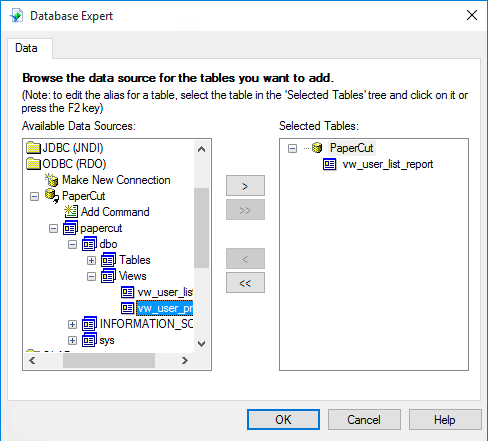
Once we have connected using our data source, we then need to find our View. Mine will be found by expanding the “ODBC (RDO)” directory, then the “PaperCut” data source, then the “dbo” (database objects) directory, and finally the “Views” directory. Once we have selected our View, we click the arrow button to add this View to our report, before hitting “OK”
You will notice the blank report template has five areas, and if you’ve ever used a word processor before, they probably sound quite familiar. What we plug in to the “Report Header” will be shown at the top of page one of our custom report, whilst a “Page Header” appears near the top of every page. “Details” is where our data is going, courtesy of our data source and View. The “Report Footer” will show up at the bottom of the very last page, and the “Page Footer”, well… you can probably guess.
We can edit this report much the same as we would as a Word document, too. We can use the “Insert” menu to add images and text, so we can add a logo and a report name to the “Report Header”. We can change the “Page Setup…” via the “File” menu to make the page orientation landscape, which gives us room for more columns of data across each page.
We can also use the “Insert” menu to add and draw a line to separate the header from the rest of the report, and throw in some text underneath it to describe the report contents in brief detail. If we right-click on any object in our report, be it text, an image, or something else, we can also choose to format it. For example, we can change the visible thickness of our line, the colour of our text, the background colour of our text boxes, and so on.
We should add a series of text boxes to our page header, one for each column header in our report, and then use the formatting tools to make these stand out. If we change the background colour of the boxes to black, and the font colour to be white, this will give us a nice black heading bar for our columns on every page.
Now let’s add some data! Open the “Field Explorer” using the “View” menu, and it will appear on the right of the screen. Expand “Database Fields” and we should find our View, and if we expand that, we can see each of the fields our View can retrieve from the database. Drag and drop the fields of our choosing into the “Details” section of the report, directly beneath the appropriate text boxes in the page header, and we have our columns completed.

We can also add some niceties, like page numbering and a timestamp, using Formula Fields. Back in the “Field Explorer”, right-click on the “Formula Fields” item and select “New…”. We give the field a name, like “PageNofM” for the page number, and then use the available “Functions” in the “Formula Explorer” that appears to choose an inbuilt formula, e.g. “PageNofM” under the “Print State” category for the page numbers.


We can then drag and drop this Formula Field into our report the same as we did for our Database Fields. We will put the “PageNofM” field in our page footer, so each page is numbered. We can then add a “DateTime” Formula Field, using the “CurrentDateTime” function found under the “Date and Time” function category back in the “Formula Workshop”.

Dragging this field into our report footer means that the time the report was run will appear at the end of the report when we export or print it. We use “Print Preview” under the “View” menu to see what the finished report will look like, and then make any adjustments to the design we need to get it looking spick and span.


And lastly, we could print our report, or choose to “Export” it via the “File” menu in order to generate a PDF copy.

There we have it, our customised User List report! Which seems suspiciously similar to the inbuilt PaperCut “User list” report, now that I’m looking at it… but now that you have a basic report to play with, along with a sense of the interface, you can start exploring the other functions of Crystal Reports in order to fashion something all of your own. You can even find this completed Crystal Reports “User list.rpt” file in our GitHub, too! And when you are comfortable, you can look into creating alternative database Views, and start pulling in all sorts of stuff from your database. Personalise, polish, and print your reports to your heart’s content; you are now in total control.
See Also
- A How-To Guide to Custom Report writing with JasperSoft Studio and PaperCut NG/MF
- Report FAQs
- Upsizing to an External Database
- Database Schema Diagrams
- Example SQL Queries (when running on an external database)
- Example Base SQL Queries GitHub Repository
- Custom Reporting Instructional Video
Keywords: custom , reporting , crystal , reports , SQL , SAP , zono
Comments